.png)


CUTTING EDGE CARDIOVASCULAR RESEARCH
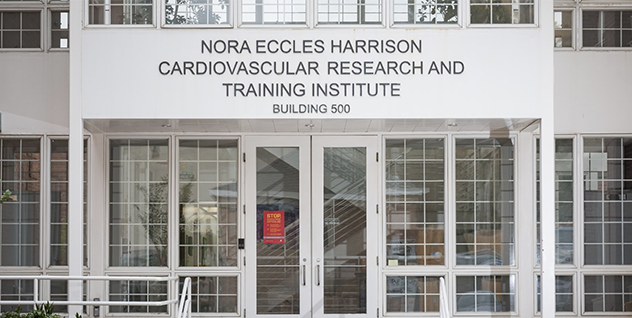
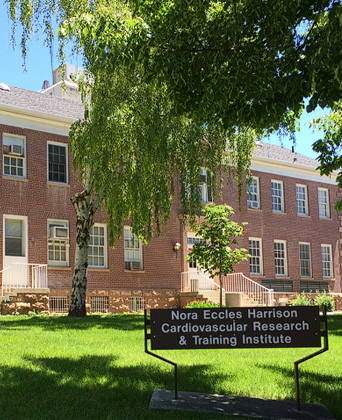
Nora Eccles Harrison Cardiovascular Research and Training Institute (CVRTI) delivers cutting-edge cell-to-bedside research and education of cardiovascular disease, which is one of the leading causes of death worldwide. At the CVRTI, we are both developing new insights into the biology of heart dmuscle cells, and developing novel therapeutics for patients with heart failure and cardiac arrhythmias such as sudden cardiac death.
Located at the University of Utah, the CVRTI nucleates a campus wide, multidisciplinary team of fourteen individual investigator laboratories who are both scientists and physician scientists. The research of the laboratories spans from basic muscle biology and channel electrophysiology to metabolism and genetics. Founded in 1969, the CVRTI is one of the oldest cardiovascular institutes in the country, and its research has already impacted clinical care from development of the first artificial heart, to the genetic basis of long QT arrhythmias, to using electricity to map heart dimensions for arrhythmia ablation, to myocardial recovery.
April Seminar Series
CVRTI Seminar Series
Thursday, April 11, 2024
12:00pm – 1:00pm (MT)
Effects of Autonomic Nervous System Activity on Arrhythmias
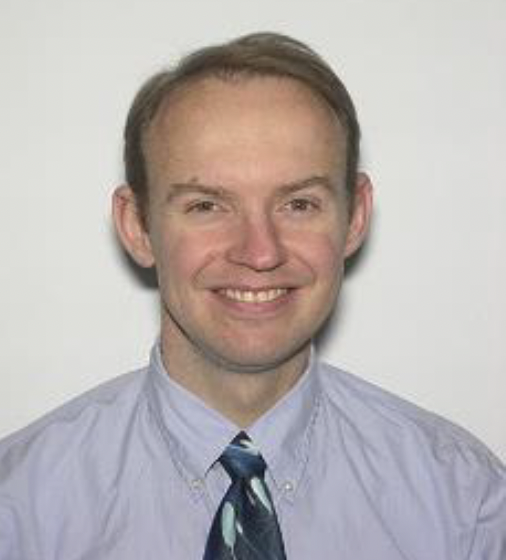
Richard Shelton MD, MSc
Salt Lake City VA Health Care System, University of Utah, Director of the Autonomic Dysfunction Clinic for the Division of Cardiology
Join us for a hybrid meeting via Zoom or at Eccles Health Sciences Education Building, EHSEB, Bldg. 575, Room 2680, 25 S. 2000 E. (Lunch Provided)
Email Nuria Anderson, nuria.anderson@utah.edu for Zoom Link
Arrhythmogenic right ventricular cardiomyopathy (ARVC) is a rare but serious heart condition characterized by the gradual replacement of the heart’s muscle tissue with fatty or fibrous tissue. This process weakens the heart muscle and disrupts its electrical signals, leading to irregular heart rhythms and potential complications like heart failure and sudden cardiac arrest.
.webp)
.jpg)
